 FoundLux
When does which bot have its weather?
The radar does not predict prices. It reads sensors that are not contained in the price — who is buying, who is selling, how many accounts are betting on rising prices — and shows whether the conditions under which a bot used to earn money are present right now.
Demonstration · simulated data.
Where to find it
Four states, for every bot
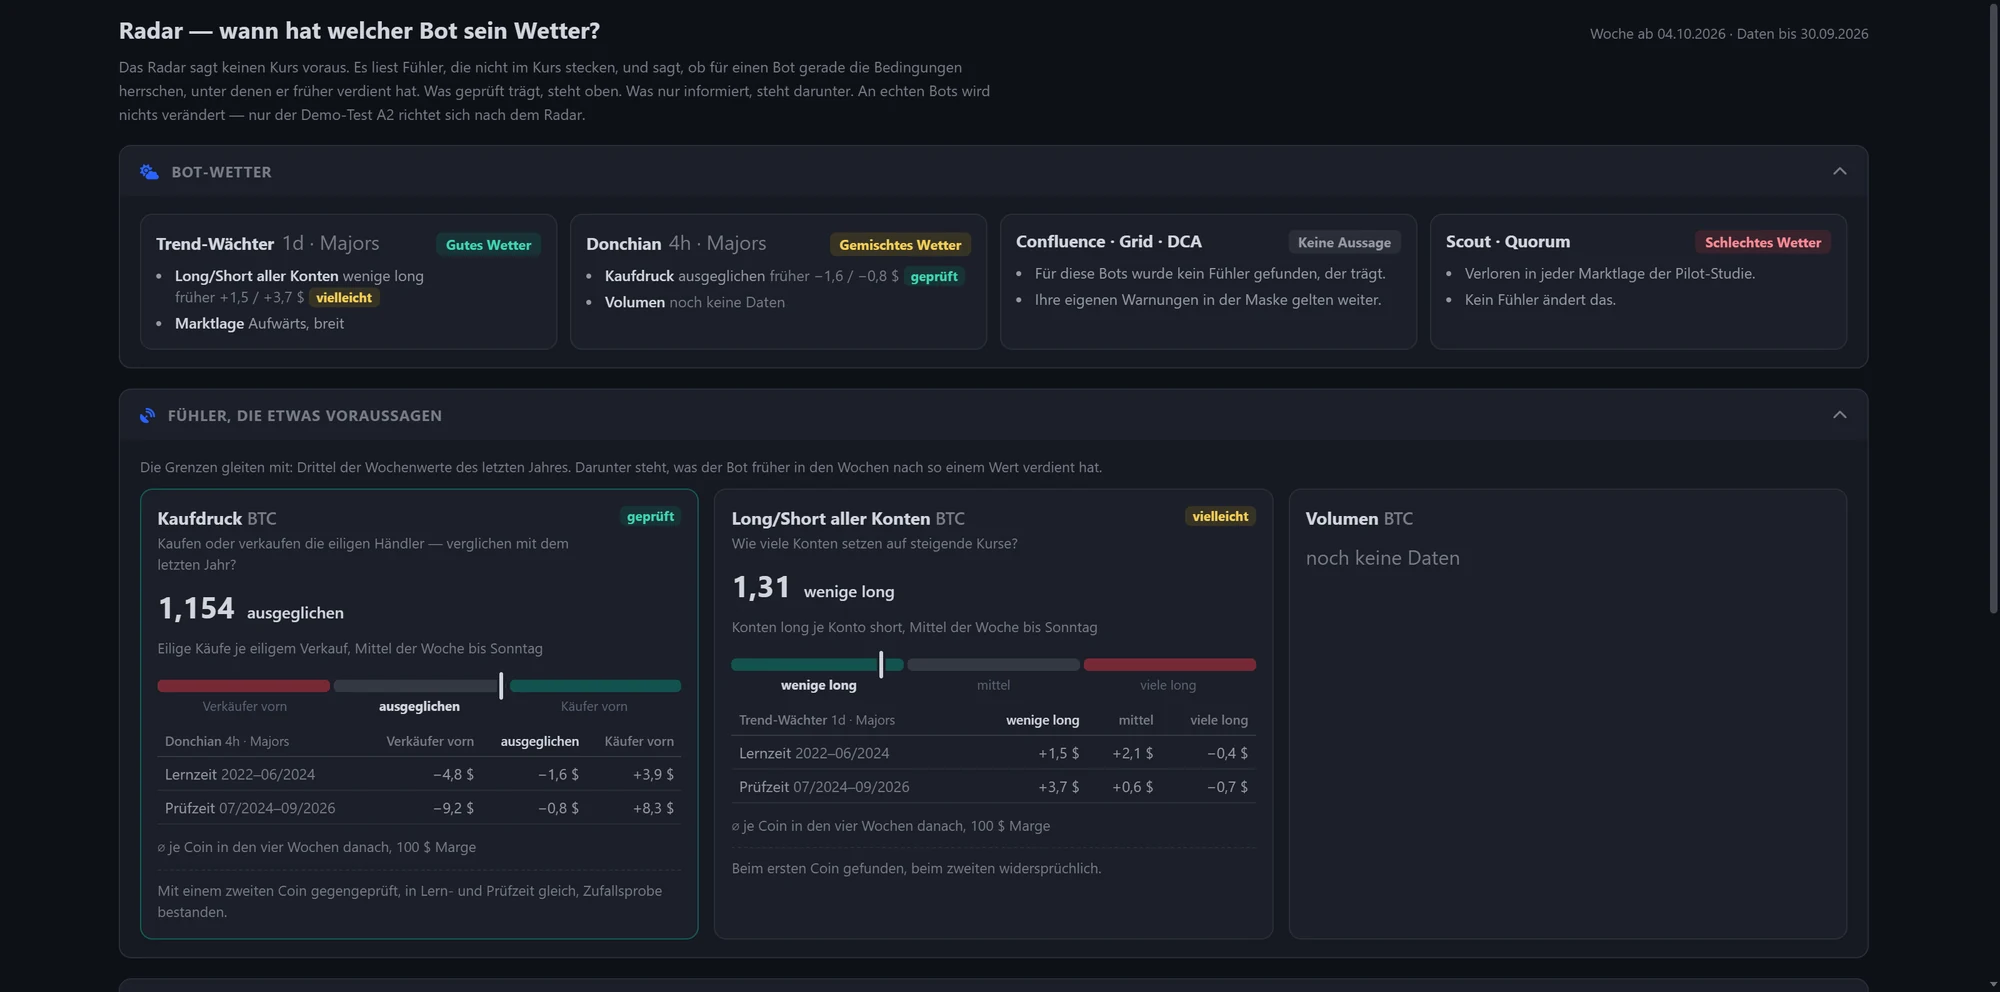
The sensor is where the bot used to earn money.
Middle third: about zero in the past.
The sensor is where the bot used to lose money.
No sensor held up for this bot.
Scout and Quorum always show bad weather: in our study they lost in every market regime. Confluence, Grid and DCA get no verdict.
What happened in such weeks in the past
One value every Sunday, compared with the 52 weeks before and split into three thirds. Below it is what the bot earned in the four weeks after — on average per coin, with $100 margin, after costs.
Buying pressure BTC → Donchian 4h
TESTEDAre impatient traders buying or selling — impatient buys per impatient sell, weekly average.
| Sellers ahead | balanced | Buyers ahead | |
|---|---|---|---|
| Learning period 2022 – 06/2024 | −4,8 $ | −1,6 $ | +3,9 $ |
| Test period 07/2024 – 09/2026 | −9,2 $ | −0,8 $ | +8,3 $ |
Cross-checked with ETH as a second coin, the same in the learning and test period, random test passed.
Long/short of all accounts → Trend Guard 1d
MAYBEHow many accounts are betting on rising prices — accounts long per account short.
| few long | medium | many long | |
|---|---|---|---|
| Learning period 2022 – 06/2024 | +1,5 $ | +2,1 $ | −0,4 $ |
| Test period 07/2024 – 09/2026 | +3,7 $ | +0,6 $ | −0,7 $ |
Found on the first coin, contradictory on the second — hence only “maybe”.
Why the bounds slide
Buying pressure has drifted over the years. With fixed bounds from the learning period, the test period spent only 5 of 109 weeks in the bottom third. The radar therefore always divides the last 52 weeks into thirds — so “low” stays low even when the whole market shifts.
This rule was made after looking at the data. That is exactly why it is now being tested going forward, not again on the same years.
Study and demo test
Since 2 October 2026 two groups of twelve Donchian bots each have been running in the demo account on the large coins: one always on, the other does not enter again as long as buying pressure is in the bottom third. 13 weeks, nothing is changed along the way.
What else you see
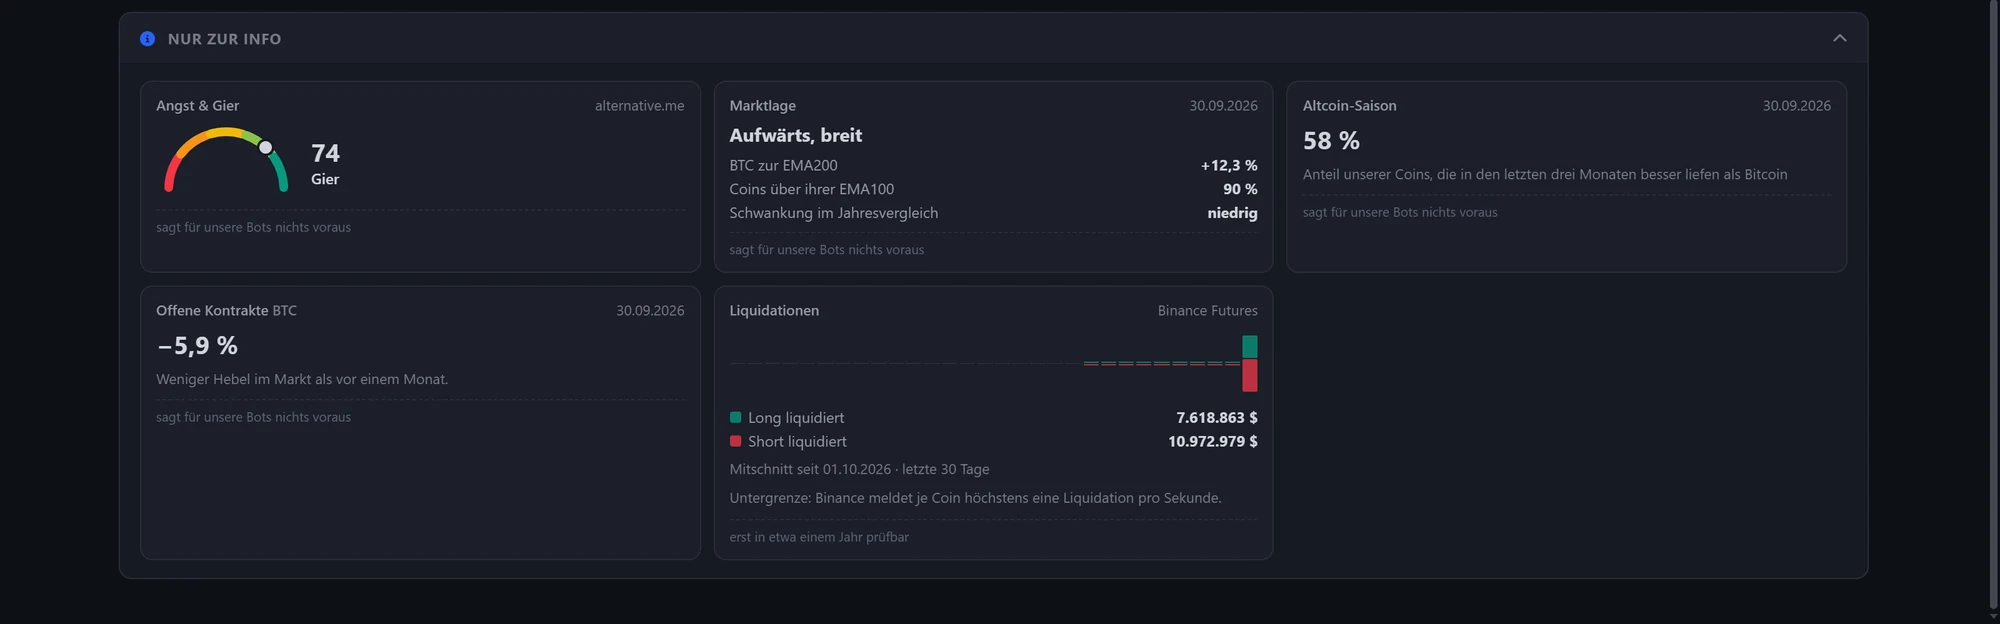
Fear & Greed, market regime, altcoin season, open interest and liquidations. They predicted nothing for our bots — they are still shown because they show how the market is ticking right now.
Always in view
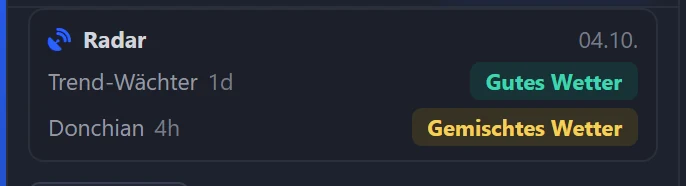
- At the top of the bots panel is the weather of the two bots for which a sensor says something
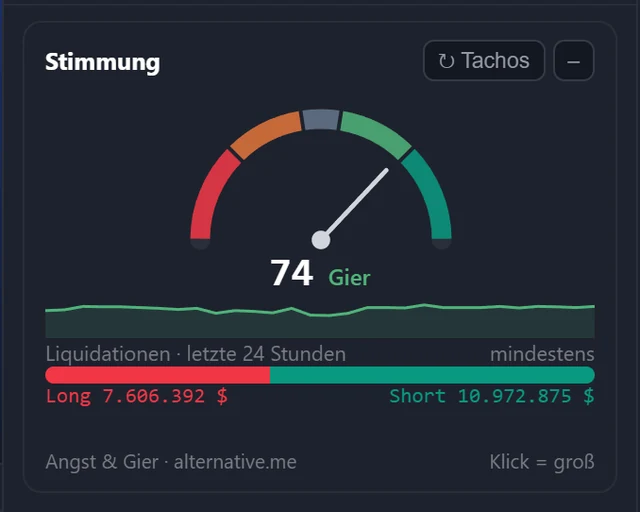
- Below the watchlist, the sentiment: Fear & Greed and the liquidations of the last 24 hours
- The radar recalculates once a week, on Sundays
See for yourself
Create an account, open the Command Center, Radar tab. No real money, no payment details.